
Updated September 23, 2025
A quick look at new-construction activity across the west Houston growth corridor, including
Fulshear, Katy, Richmond, Brookshire, Rosenberg, and Simonton. This report covers Active inventory, plus homes that are Pending or in Option, and recent Closings.
(I'll do a secondary-market [used homes] activity report in a separate post.)
Market Snapshot
| Status | Count | Avg List Price | Median List Price | Avg List $/SF |
|---|---|---|---|---|
| Active | 780 | $485,881 | $449,968 | $186/SF |
| Pending/Option | 416 | $579,851 | $428,604 | $217/SF |
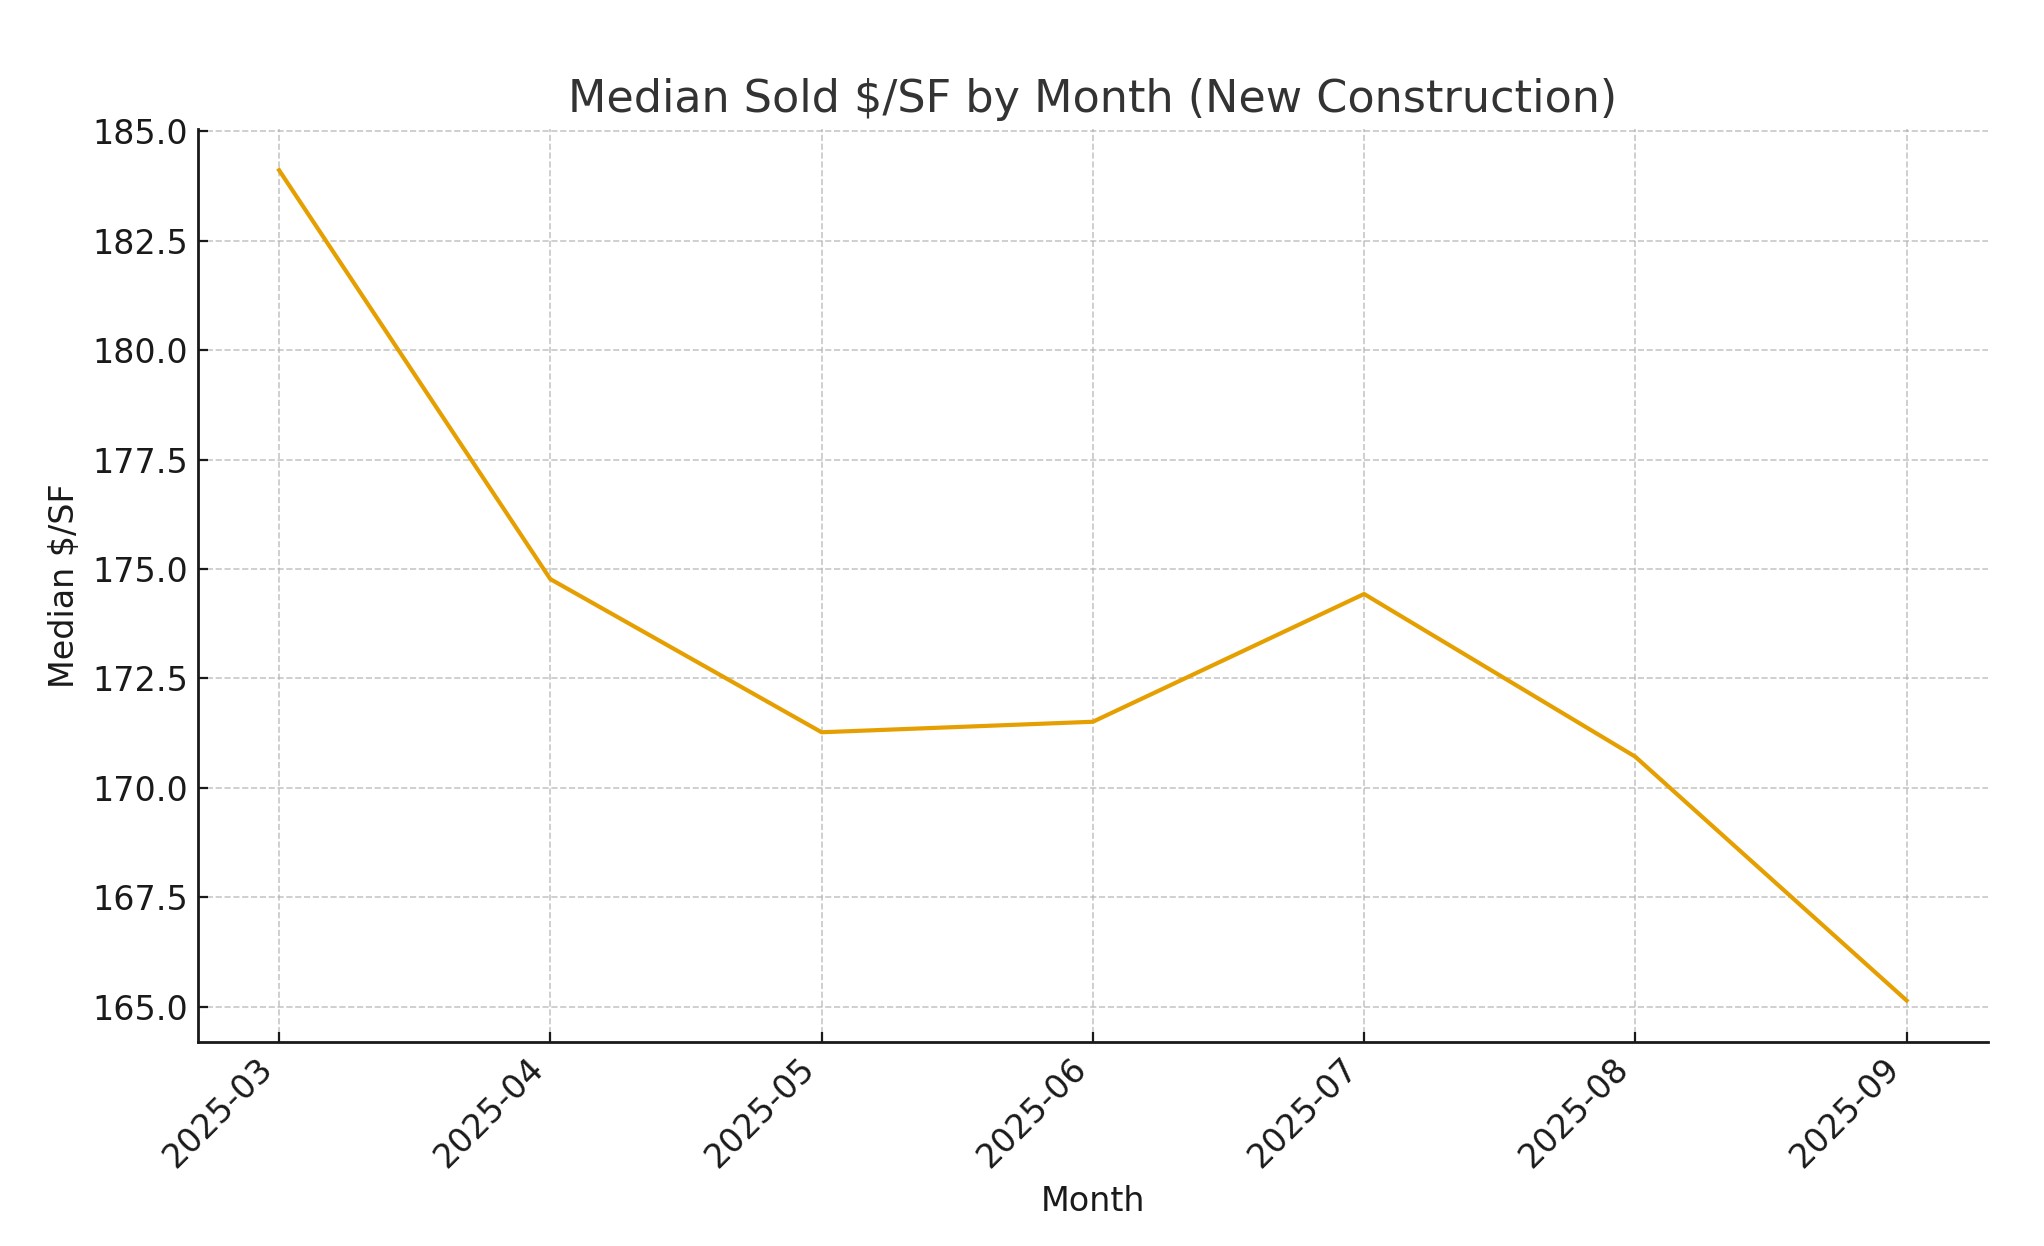
| Closed | 1,400 | $449,706 | $408,295 | $175/SF |
| All New Construction | 2,596 | $489,797 | $439,072 | $188/SF |
Zip Code Comparison
| Zip | Listings | Active | Pending | Closed | Avg List Price | Avg List $/SF |
|---|---|---|---|---|---|---|
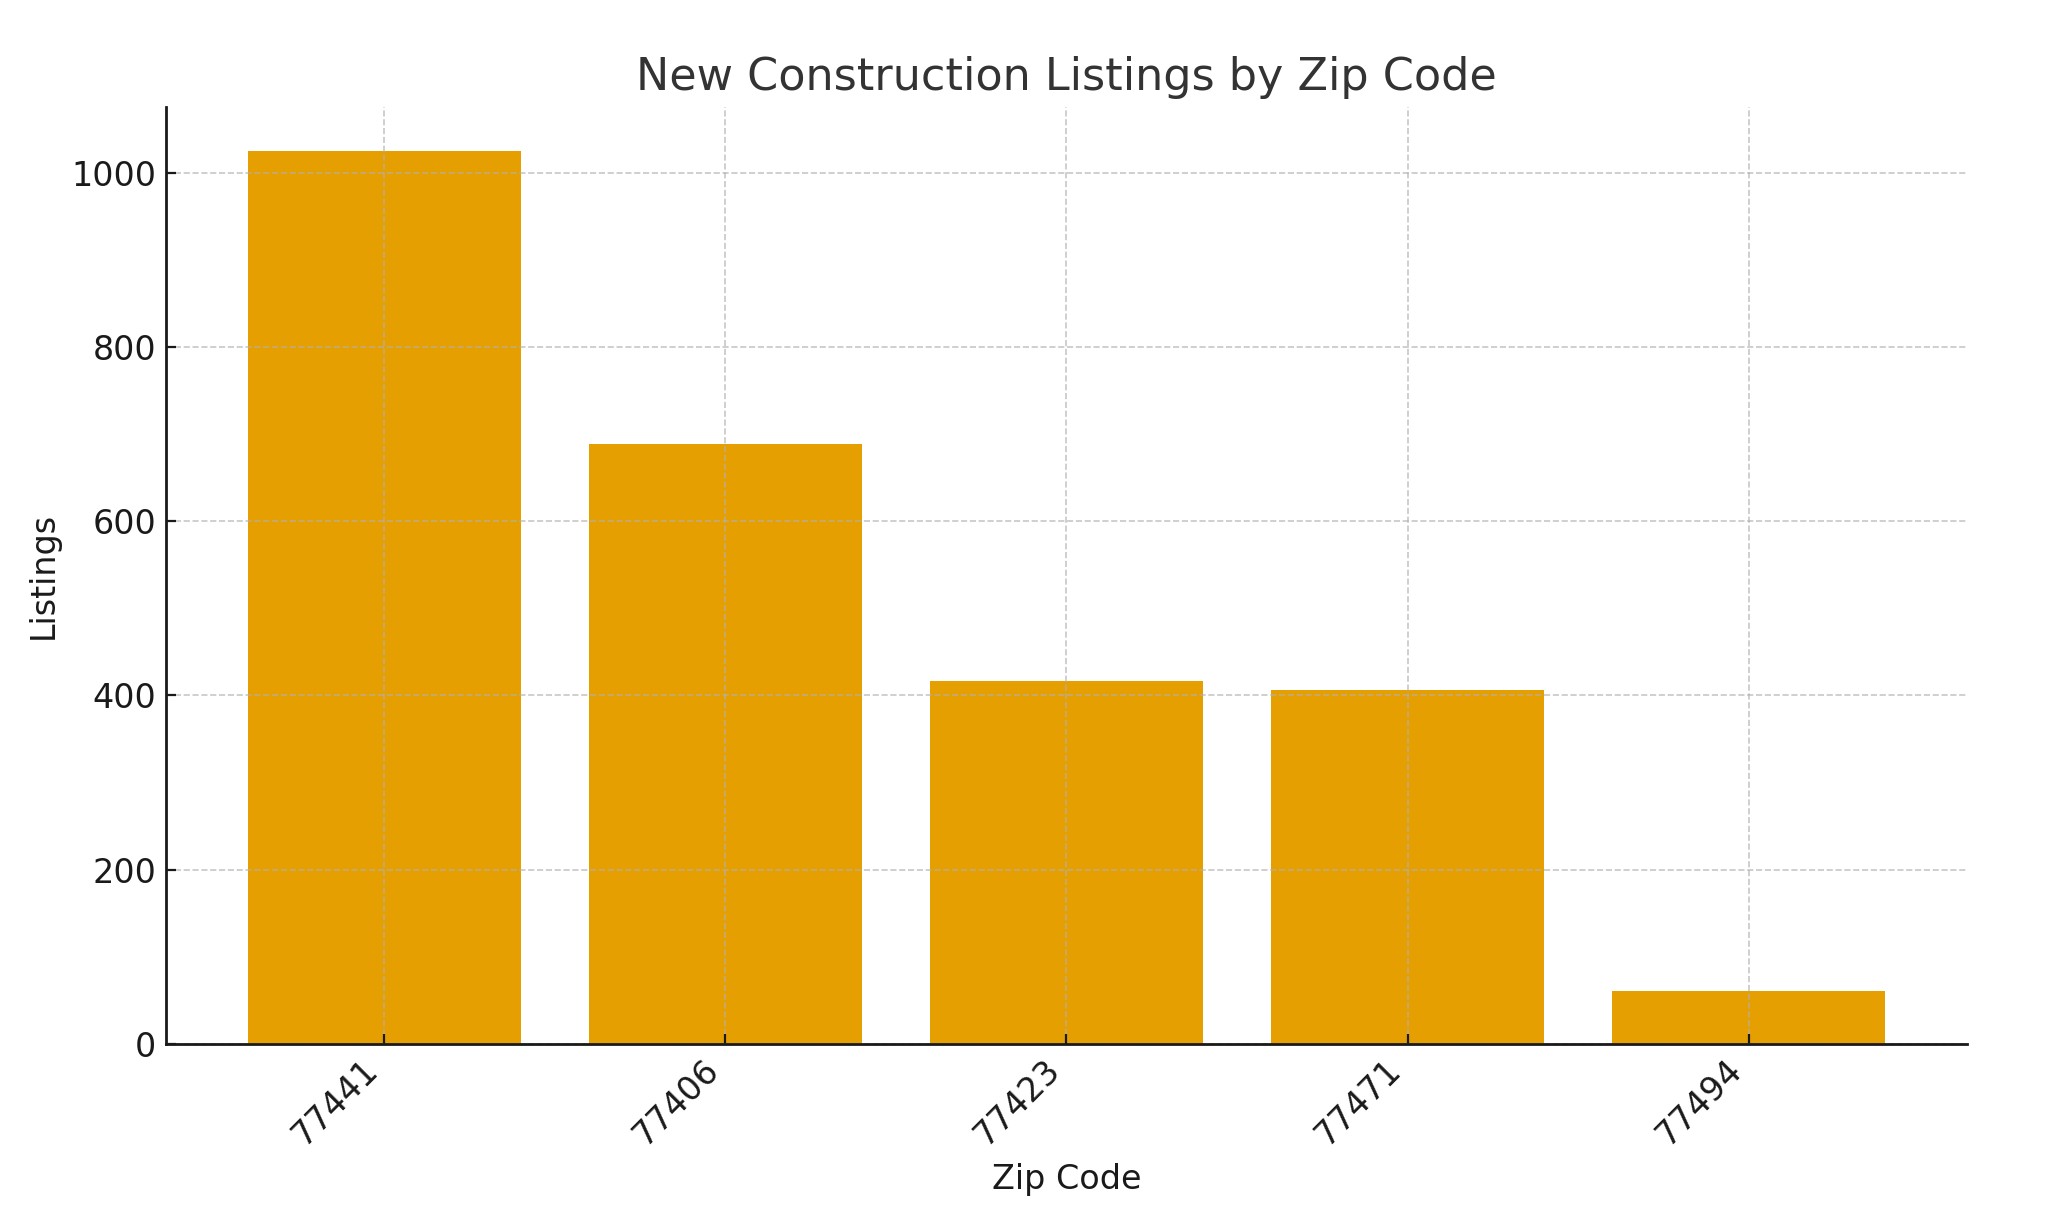
| 77441 | 1025 | 256 | 146 | 623 | $533,201 | $196/SF |
| 77406 | 689 | 211 | 113 | 365 | $499,589 | $196/SF |
| 77423 | 416 | 142 | 74 | 200 | $433,470 | $180/SF |
| 77471 | 406 | 151 | 55 | 200 | $412,151 | $162/SF |
| 77494 | 60 | 20 | 28 | 12 | $551,821 | $204/SF |
Top Subdivisions by Activity
| Subdivision | Listings | Active | Pending | Closed |
|---|---|---|---|---|
| Tamarron | 324 | 27 | 41 | 256 |
| Jordan Ranch | 233 | 76 | 37 | 120 |
| Candela | 207 | 67 | 34 | 106 |
| Cross Creek West | 164 | 61 | 30 | 73 |
| Brookewater | 155 | 50 | 22 | 83 |
| Harvest Green | 148 | 32 | 18 | 98 |
| Sorrento | 128 | 19 | 19 | 90 |
| Fulshear Lakes | 87 | 38 | 13 | 36 |
| Candela South | 83 | 27 | 9 | 47 |
| Kingdom Heights | 83 | 27 | 24 | 32 |
| Bluestem | 79 | 22 | 14 | 43 |
| Summerview | 73 | 30 | 8 | 35 |
| Indigo | 70 | 58 | 12 | 0 |
| Miller's Pond | 67 | 25 | 5 | 37 |
| Fulbrook on Fulshear Creek | 66 | 20 | 8 | 38 |
Active Inventory by Price Band
| Price Band | Active Listings |
|---|---|
| <300k | 32 |
| 300-400k | 222 |
| 400-500k | 248 |
| 500-600k | 141 |
| 600-750k | 90 |
| 750k-1M | 35 |
| >1M | 12 |
Key Takeaways
- 77441, 77406, and 77423 are leading the volume for new homes near Fulshear, Katy, and Brookshire.
- Most Active inventory sits between 300k and 750k, with premium product above 750k in master planned sections.
- Pending and Option activity indicates healthy absorption where builders have the right mix of price, plans, and lots.
Breaking it down:
The west side of Houston continues to surge with new construction, particularly in the fast-growing areas of Fulshear, Katy, Richmond, Brookshire, Rosenberg, and Simonton. Builders remain active, and buyers are responding, which creates a steady rhythm of listings, pending contracts, and closings each month.
Inventory and Demand
At the moment, there are more than 750 Active new construction listings, a strong signal that builders are still confident in demand. Pending and Option contracts account for over 400 homes, and the MLS recorded roughly 1,400 closed sales within the last 6 months. That balance tells us two things: first, builders are delivering plenty of product, and second, the market is absorbing it at a healthy pace.
Pricing
Across the region, the average list price sits just under $490,000, with a median of about $439,000. Price per square foot averages in the high $180s. In practical terms, this means the sweet spot for most families remains in the $300,000 to $600,000 range, which accounts for the bulk of the inventory. Premium product is still moving, though, with a meaningful number of homes listed above $750,000, especially in master-planned communities that offer larger lots and upgraded amenities.
Zip Code Insights
Three zip codes dominate the market:
- 77441 (Fulshear) leads the pack with more than 1,000 listings during the period, including 256 active homes and 623 closings. This area is ground zero for new community development, and price per square foot averages around $196.
- 77406 (Richmond) shows similar strength with 689 listings and solid absorption. This zip continues to appeal to buyers who want quick access to Westpark Tollway and Grand Parkway while staying close to established schools and retail.
- 77423 (Brookshire) is growing fast, with more than 400 listings and over 200 closings. Many first-time and move-up buyers are finding strong value here compared to adjacent Katy sections.
Community Highlights
A handful of subdivisions stand out as leaders:
- Tamarron continues to produce steady activity, with more than 300 listings captured in our dataset.
- Jordan Ranch and Candela are both expanding rapidly, each generating more than 200 listings with strong pending pipelines.
- Cross Creek West is the latest extension of Fulshear’s marquee master-planned community, already delivering high inventory counts and consistent sales.
- Brookewater is emerging as a notable new name, showing early traction with more than 150 listings and strong closed numbers.
What This Means for Buyers
If you’re shopping for a new home, you’ll find plenty of choices between $300,000 and $750,000 across multiple communities. Each subdivision offers a slightly different mix of builder incentives, lot types, and amenity packages. Knowing which sections have active contracts versus sitting inventory can help you negotiate better terms. Areas with strong pending counts suggest buyer competition is higher, while communities with more stagnant active listings may leave more room to secure concessions.
What This Means for Sellers
For homeowners thinking about selling a nearly new property, this market can be a double-edged sword. On one hand, steady demand means plenty of active buyers. On the other hand, you’re competing directly with builders who are offering new homes and often layering in incentives like closing cost assistance or design upgrades. Correct pricing is essential, and so is highlighting the upgrades or custom touches that a builder won’t replicate at the base price.
Closing Thought
West Houston’s new construction market is healthy, competitive, and diverse. Fulshear and Katy remain the heavyweights, but Richmond and Brookshire are not far behind. Buyers have options, sellers have competition, and builders are clearly not slowing down. This is a market where having the right data and the right agent can make all the difference in strategy and outcome.